


* Report Plan:
* Paraphrase paragraph: gives information about>compares; growth>increase; prediction>projected
* Overview/summary paragraph: (1) percentage of urban population rose in all 3 regions and the world from 1950 to 2000 (2) it is forecast to rise further by 2030
*Paragraph 3: report figures and trends globally; report figures and trends for Latin America
* Paragraph 4: compare the similar figures and trends for Africa and Asia in the whole period
* Report:
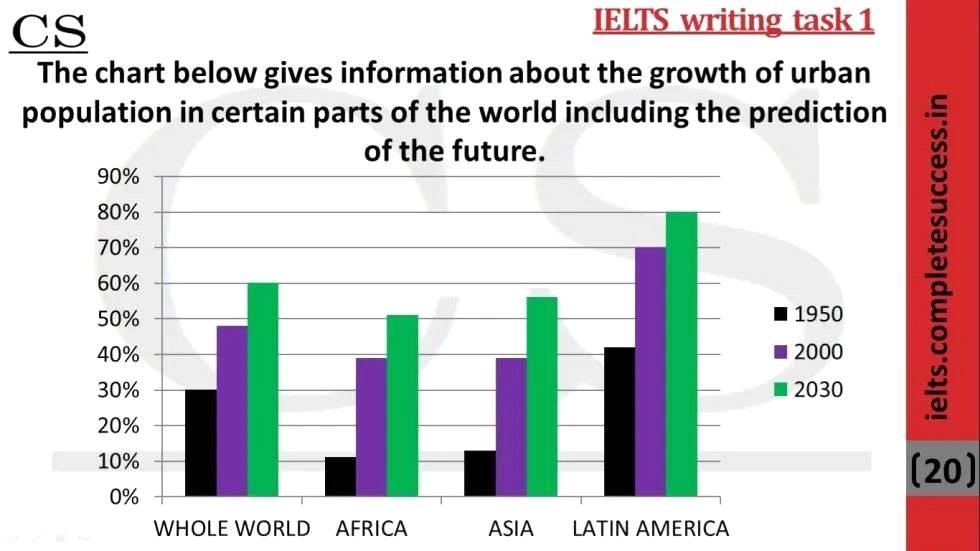
The bar chart compares urban population increase in 3 regions and in the whole world in 1950, 2000 and projected growth by 2030.
Overall, the proportion of the population living in cities rose in 2000 compared with 1950 in all regions and in the world as a whole. It is forecast to rise further by 2030.
In 1950, the percentage of urban dwellers in the world stood at 30%, but by 2000 almost half of the world’s population lived in urban centres. By 2030 the figure is expected to rise to 60%. Latin America had the highest proportion of people living in towns and cities, rising from about 40% in 1950 to 70% in 2000, with a predicted further increase to 80% in 2030.
The figures and trends for Africa and Asia are similar. In Africa, about 11% of the population were urban dwellers in 1950, compared with 12% in Asia. In 2000 this increased to almost 40% in both continents. By 2030, the figures are projected to reach 50% in Africa and 55% in Asia.
176 words
(Sưu tầm)